Note: The content layout is adaptive according to the screen size.
Realtime Option Flow
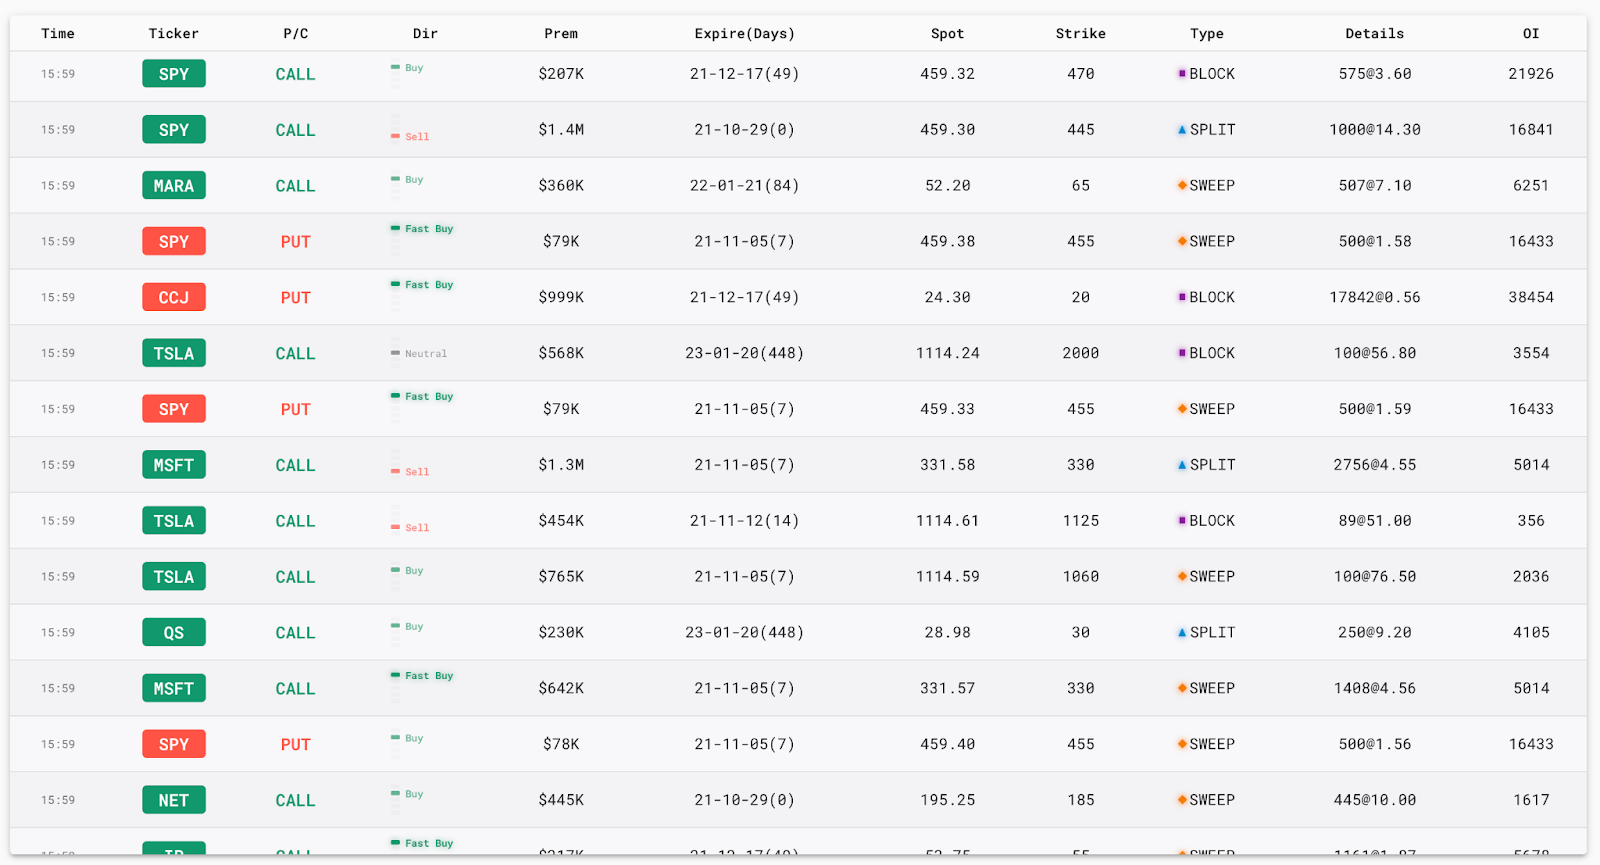
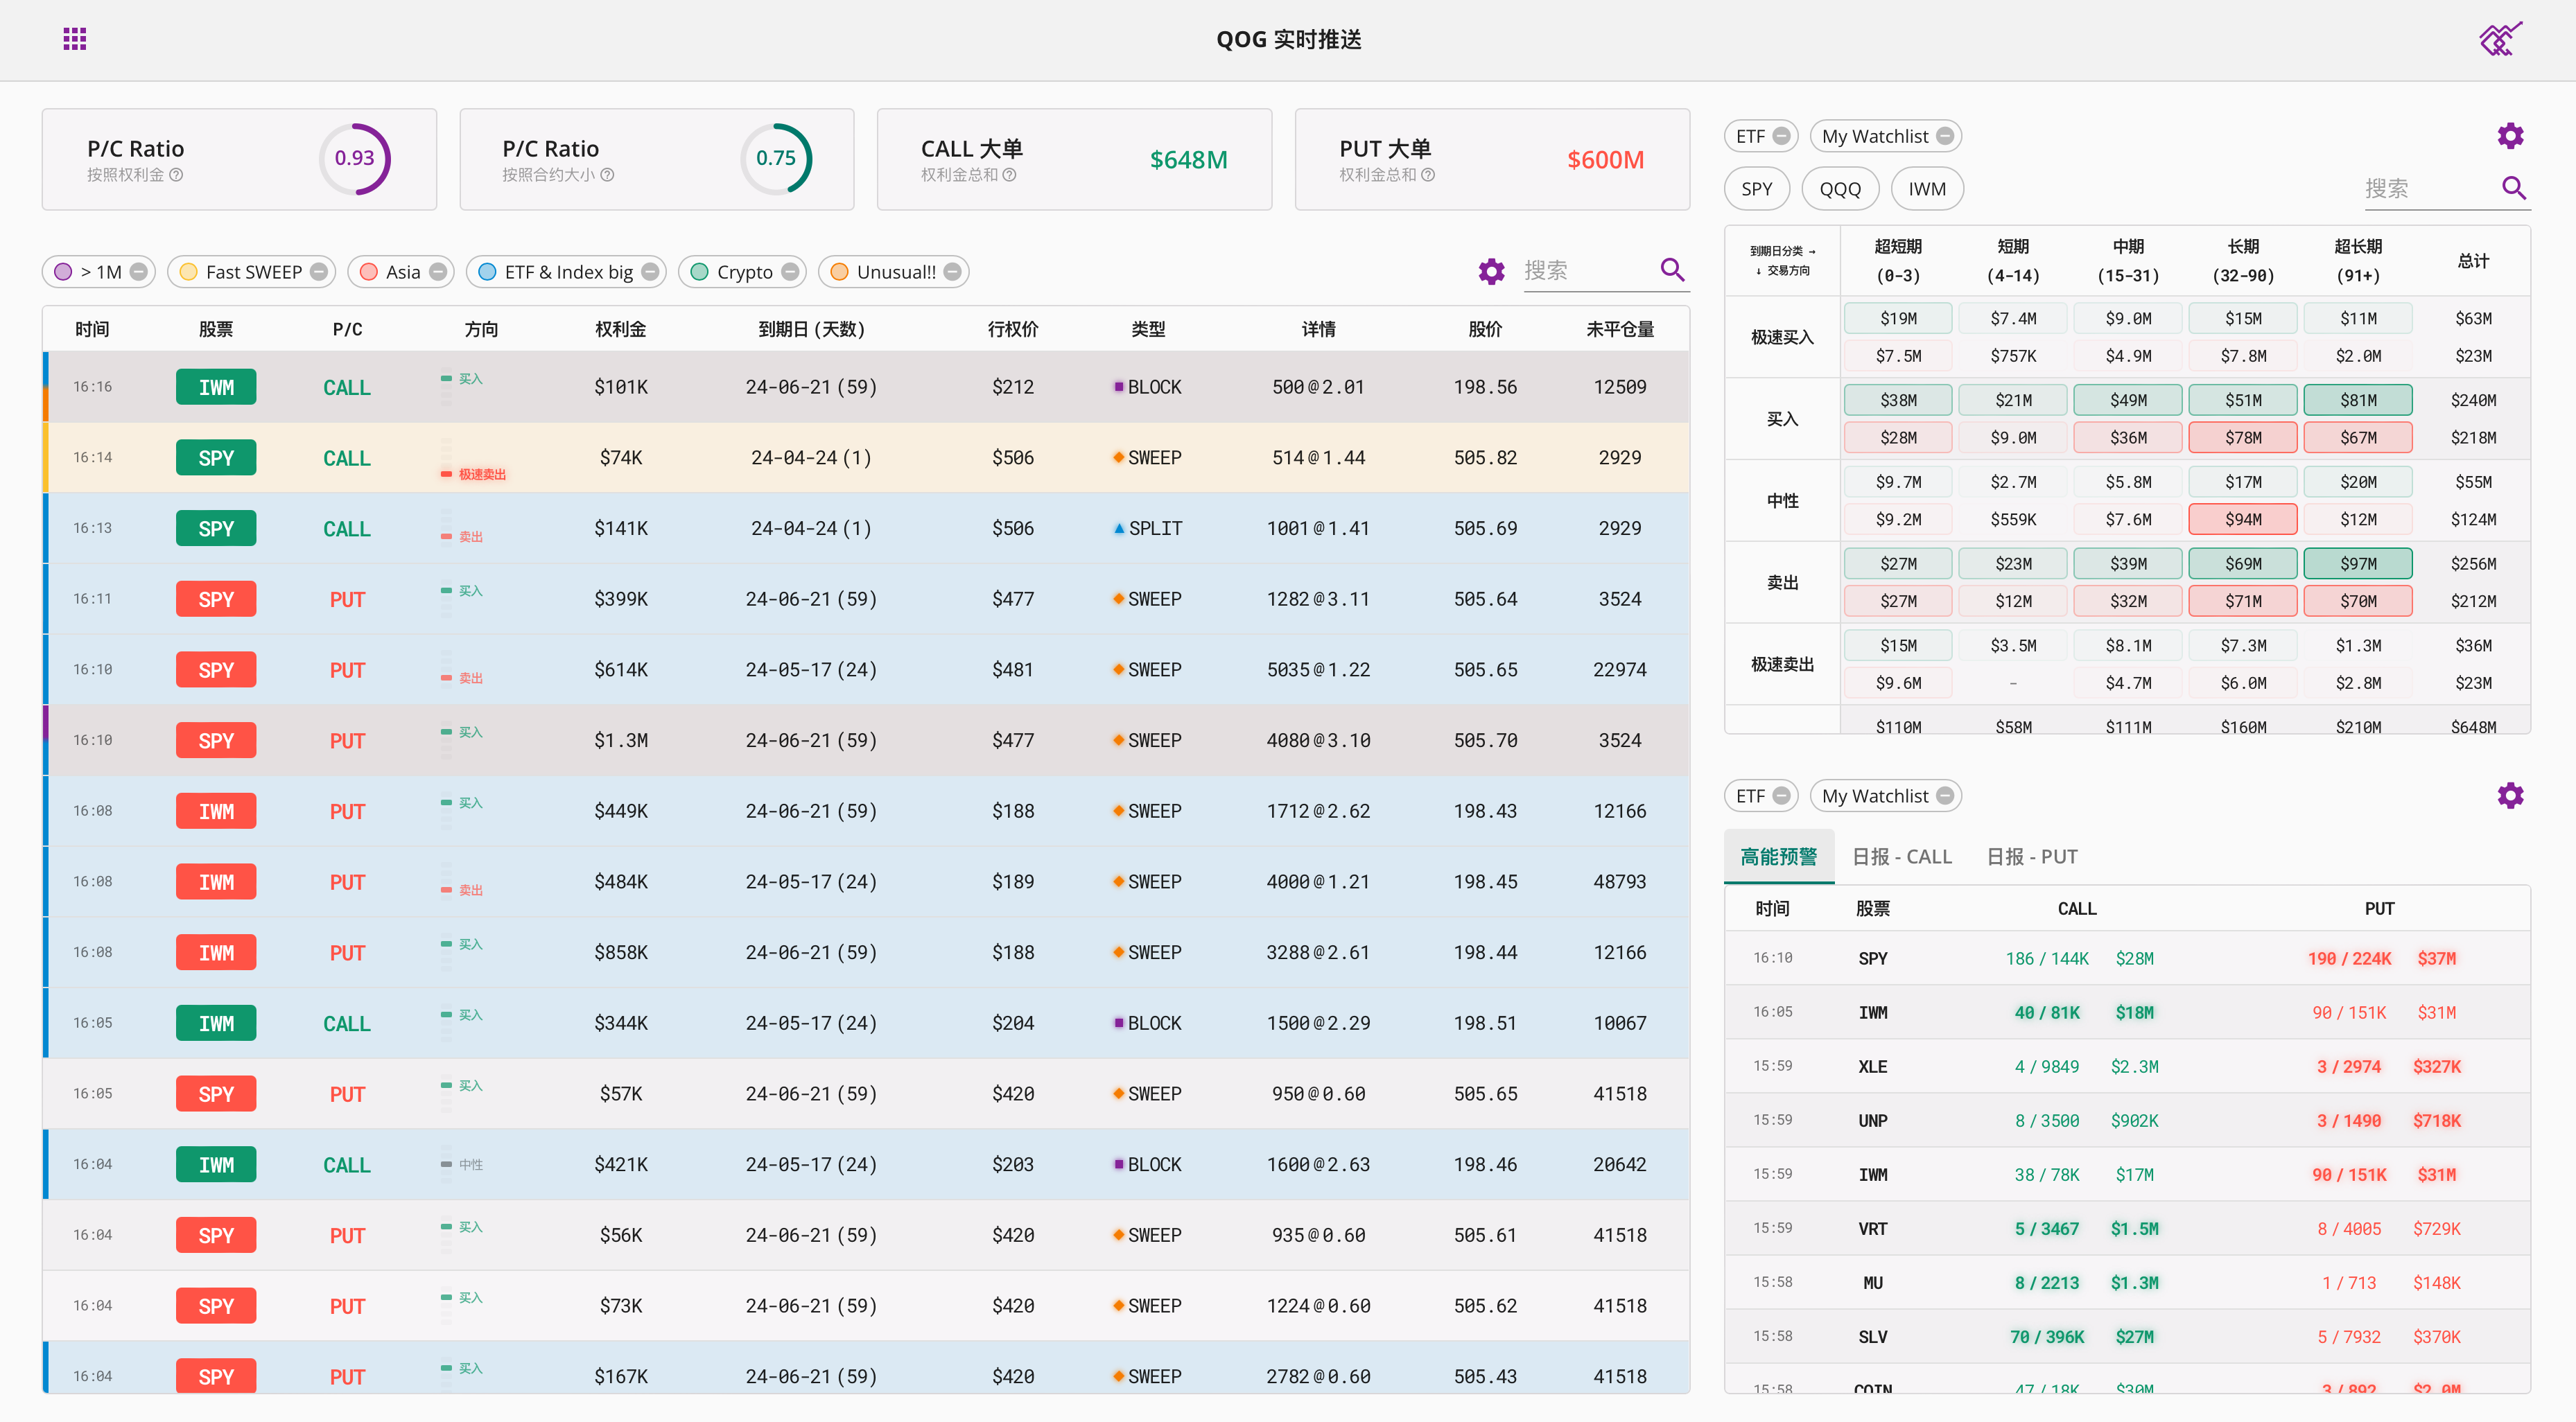
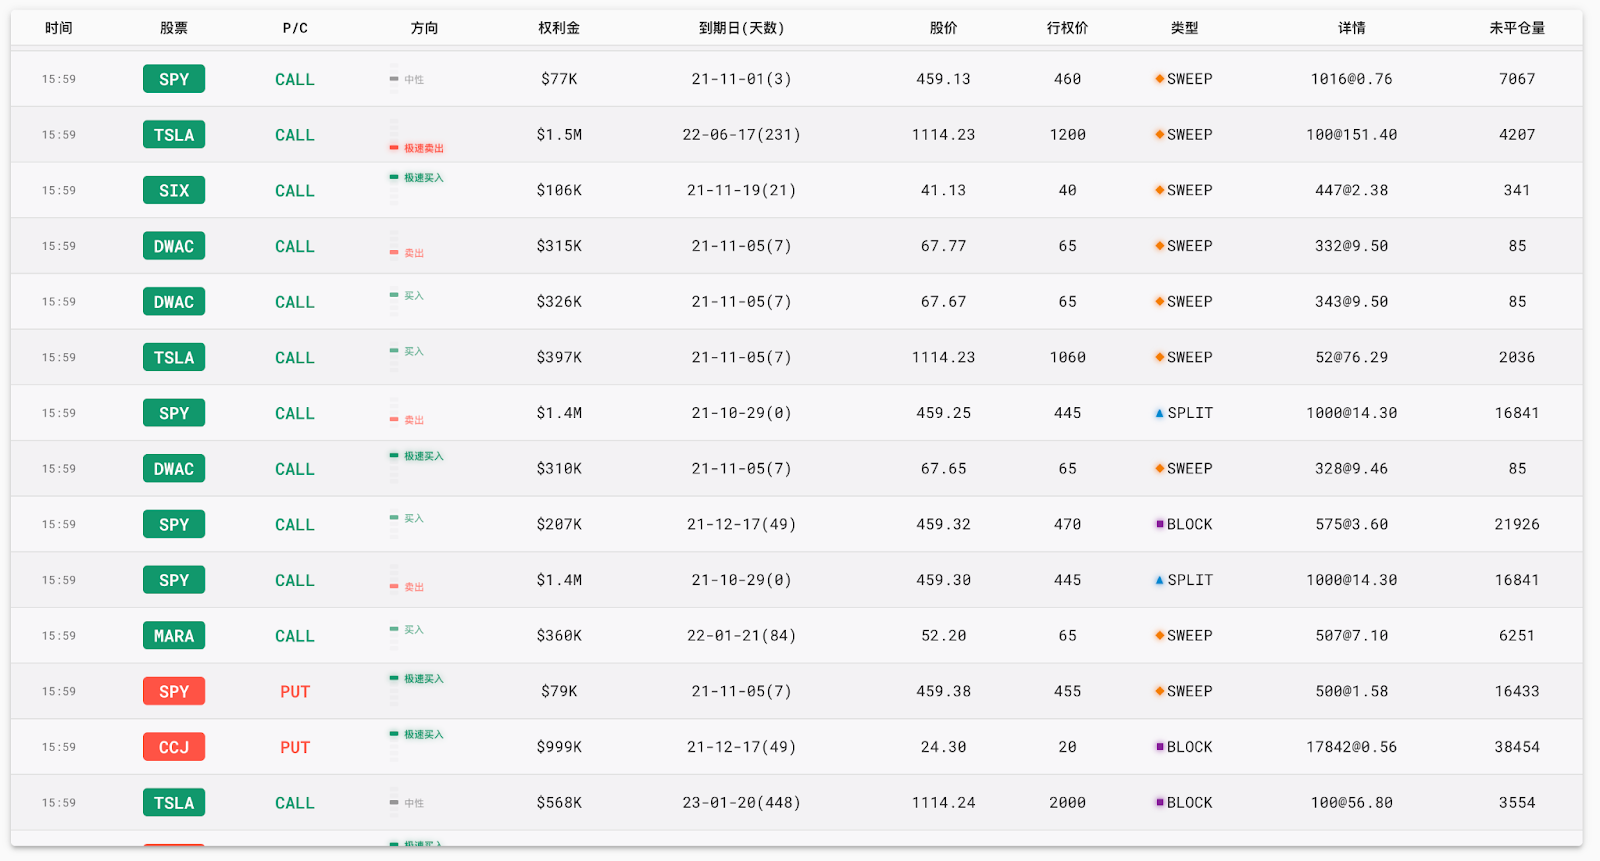
Options push service provides real-time push of QOG selected option flow, option data including:
- Time (eastern time)
- Stock ticker
- P/C (PUT or CALL)
- Direction (see detailed explanation below)
- Premium amount
- Expiration date (number of days left to expiration)
- Current stock price
- Strike price
- Type (see detailed explanation below)
- Details (option contract size & premium per contract)
- OI (open interest by last trading day, not real time)
Direction:
- Fast Buy: Trade much higher than current price, which appears when the buyer aggressively buys
- Buy: Trade higher than current price, which appears when buyer buys actively
- Neutral: Trade is executed at current price
- Sell: Trade lower than current price, which appears when seller sells actively
- Fast Sell: Trade much lower than current price, which appears when the seller aggressively sells
Transaction Type:
- Sweep: Multi-exchange transactions, which are divided into different segments to take advantage of all available contracts at the best prices currently offered by all exchanges
- Block: Block transactions refer to a single transaction declaration for securities that reaches a prescribed minimum limit. The buyer and the seller reach an agreement through an agreement and the securities transaction is confirmed by the exchange
- Split: Single exchange transactions, single trader places multiple orders on the same exchange at the same time
Please note: The data is calculated based on QOG option flow, and is the result after excluding market index. If you wish to see data related with market index, please setup a custom filter.
Intraday Option Statistics
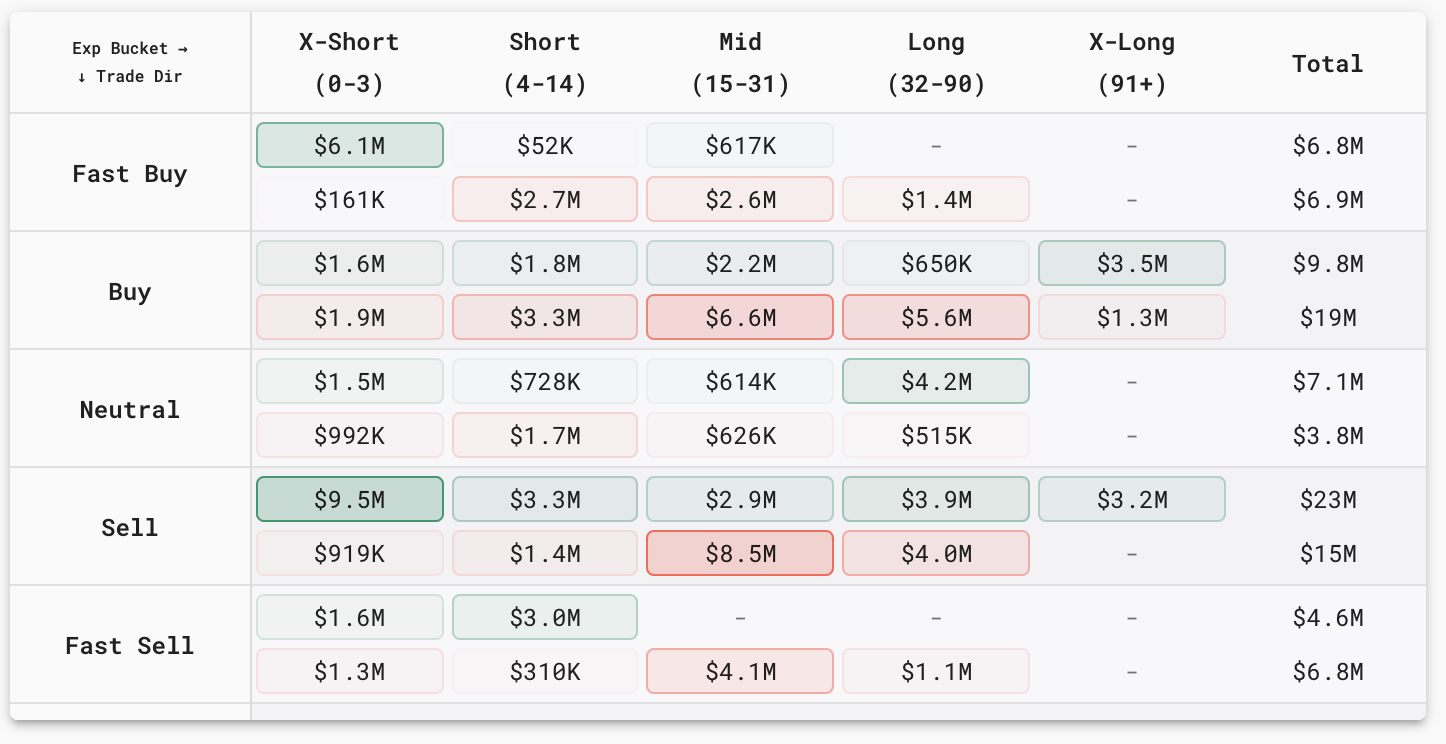
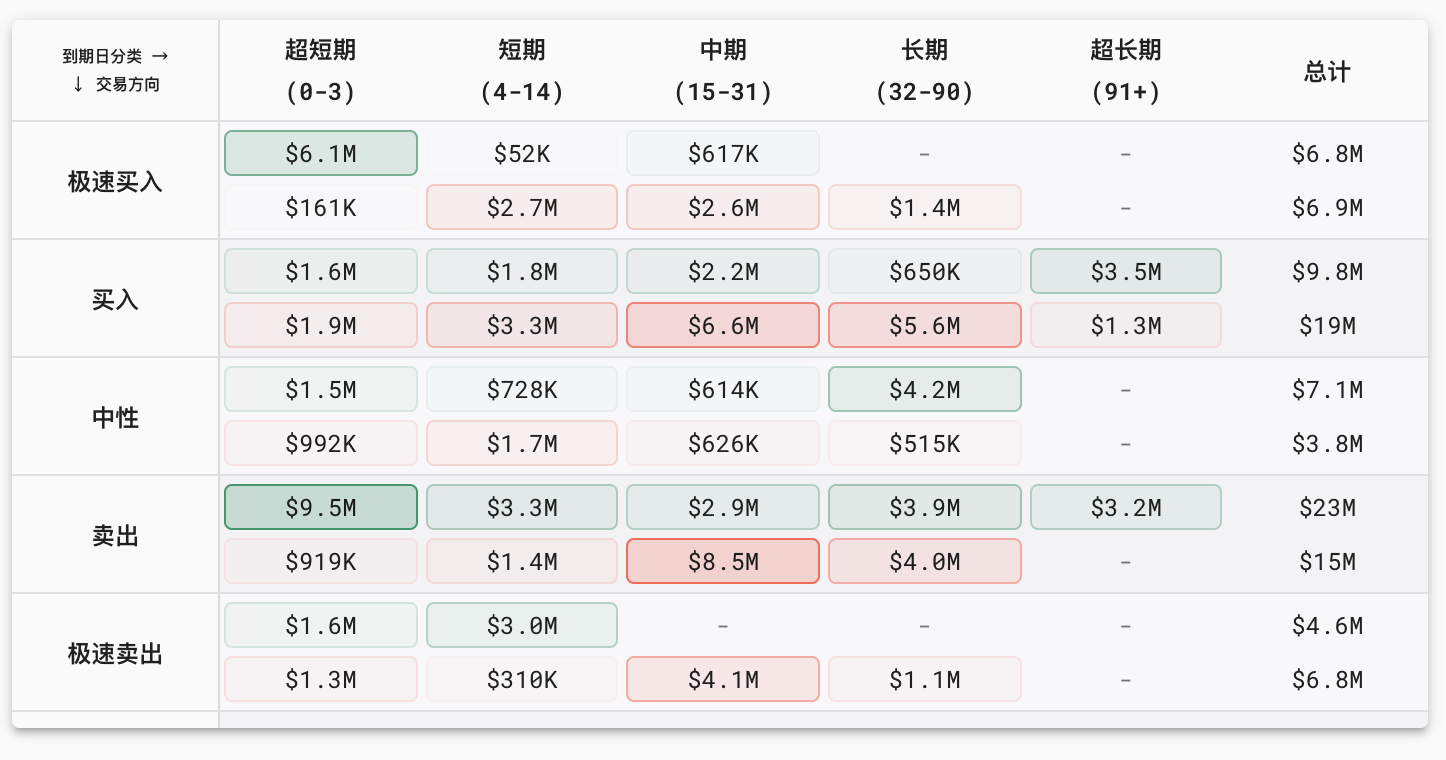
Functionality: The Intraday Statistics Chart offers a comprehensive summary based on the classification of expiration dates and trading directions.
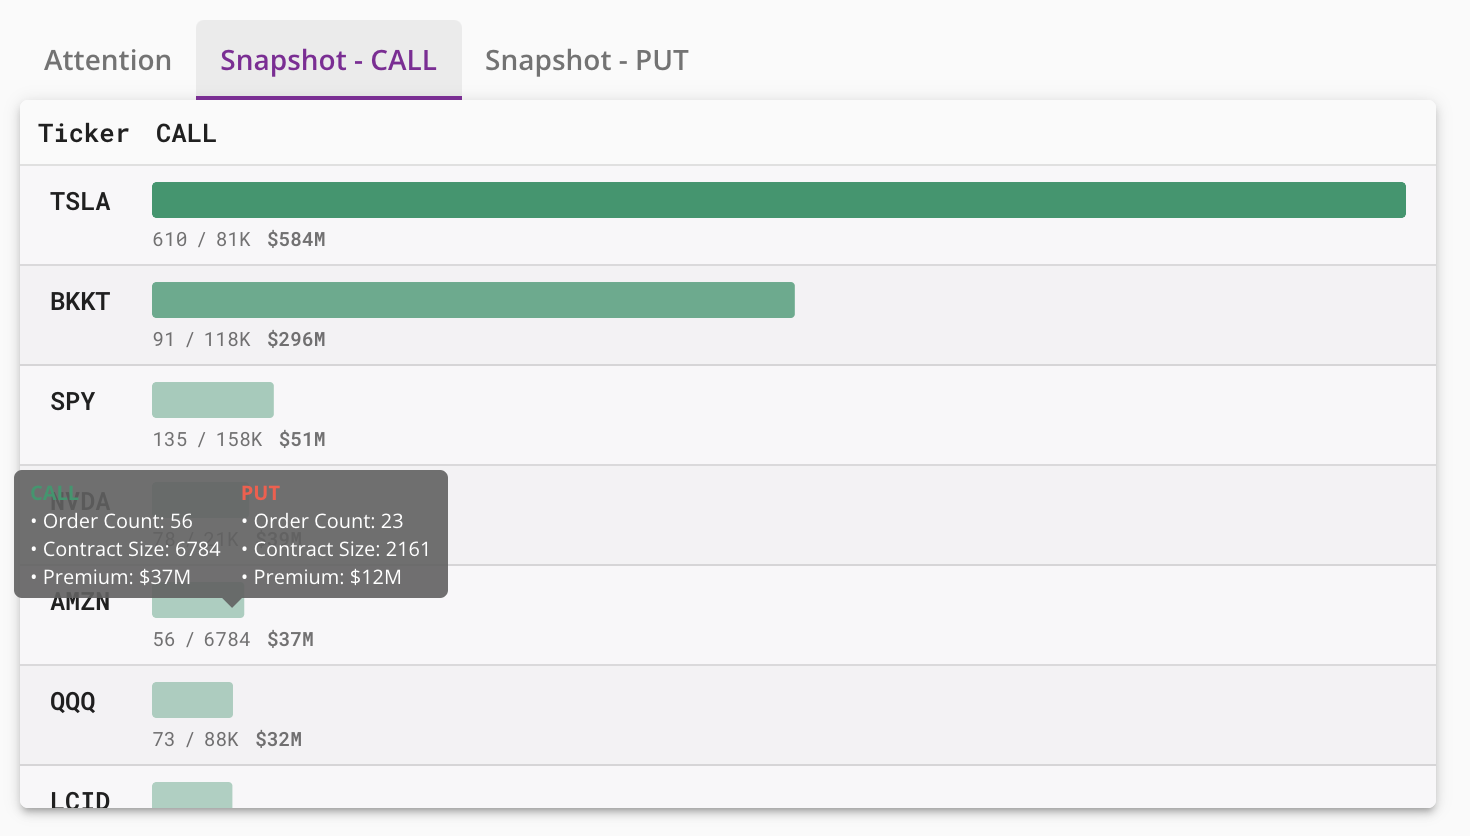
In each cell, the top number (displayed in green) represents the call amount data, while the bottom number (displayed in red) represents the put amount data. The color shade is indicative of the premium amount, with the shading intensifying in proportion to the premium value. For a detailed view of option specifics, simply hover your mouse cursor over the respective amount, as illustrated in the chart below:

Order Count: This metric represents the count of option flow within the selected time range, not to be confused with the total number of options traded.
Contract Size: It denotes the aggregate sum of contracts associated with all option flow.
Premium: The Premium figure corresponds to the cumulative total of premiums associated with the option flow.
Filters can be effectively employed to narrow down and display intraday summaries tailored to specific stocks or stock types.
Please note: The data is calculated based on QOG option flow, and is the result after excluding market index. If you wish to see data related with market index, please setup a custom filter.
Attention Flow
Functionality: Attention Flow for Rapid Detection of Active Options Trades
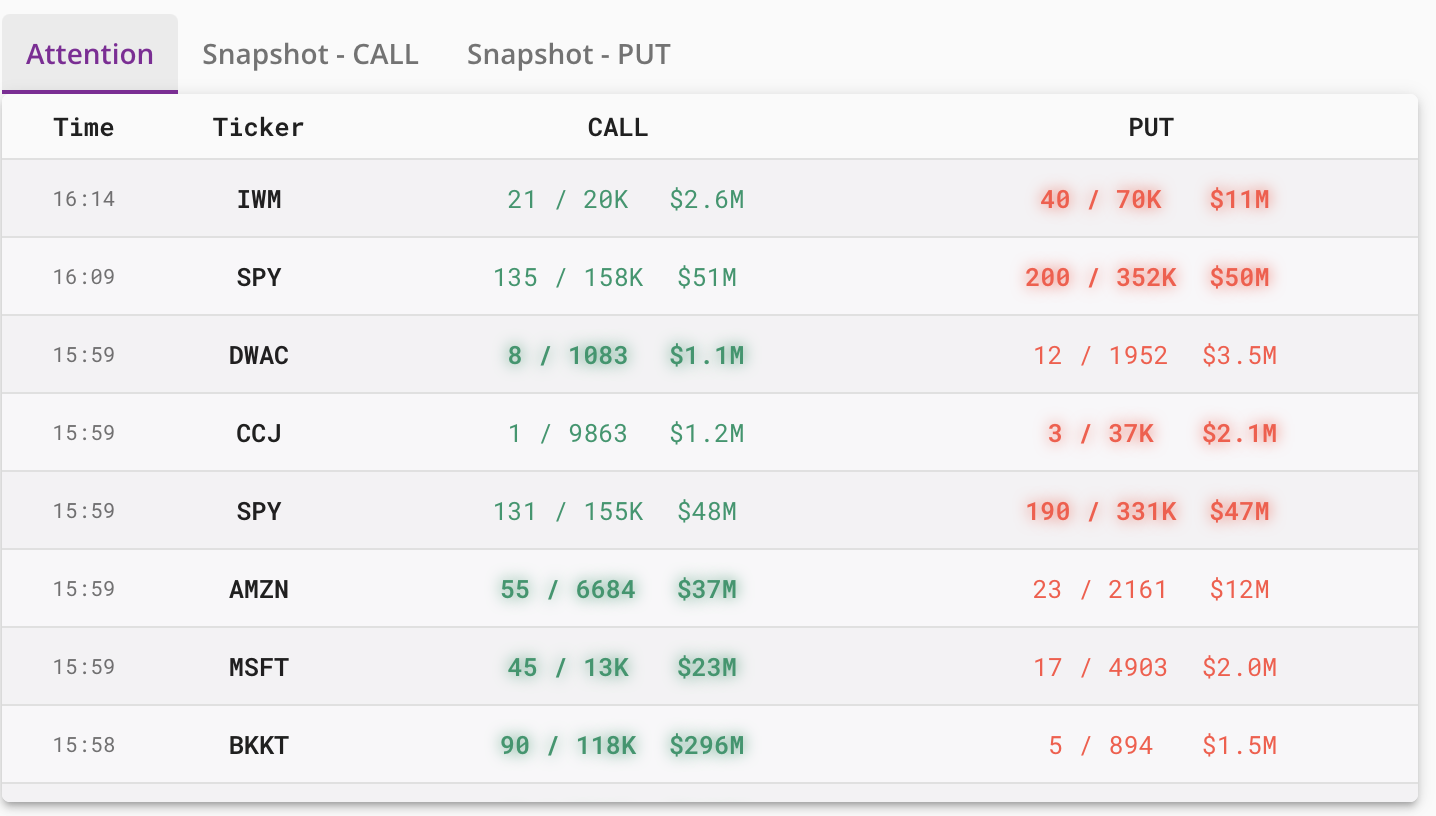
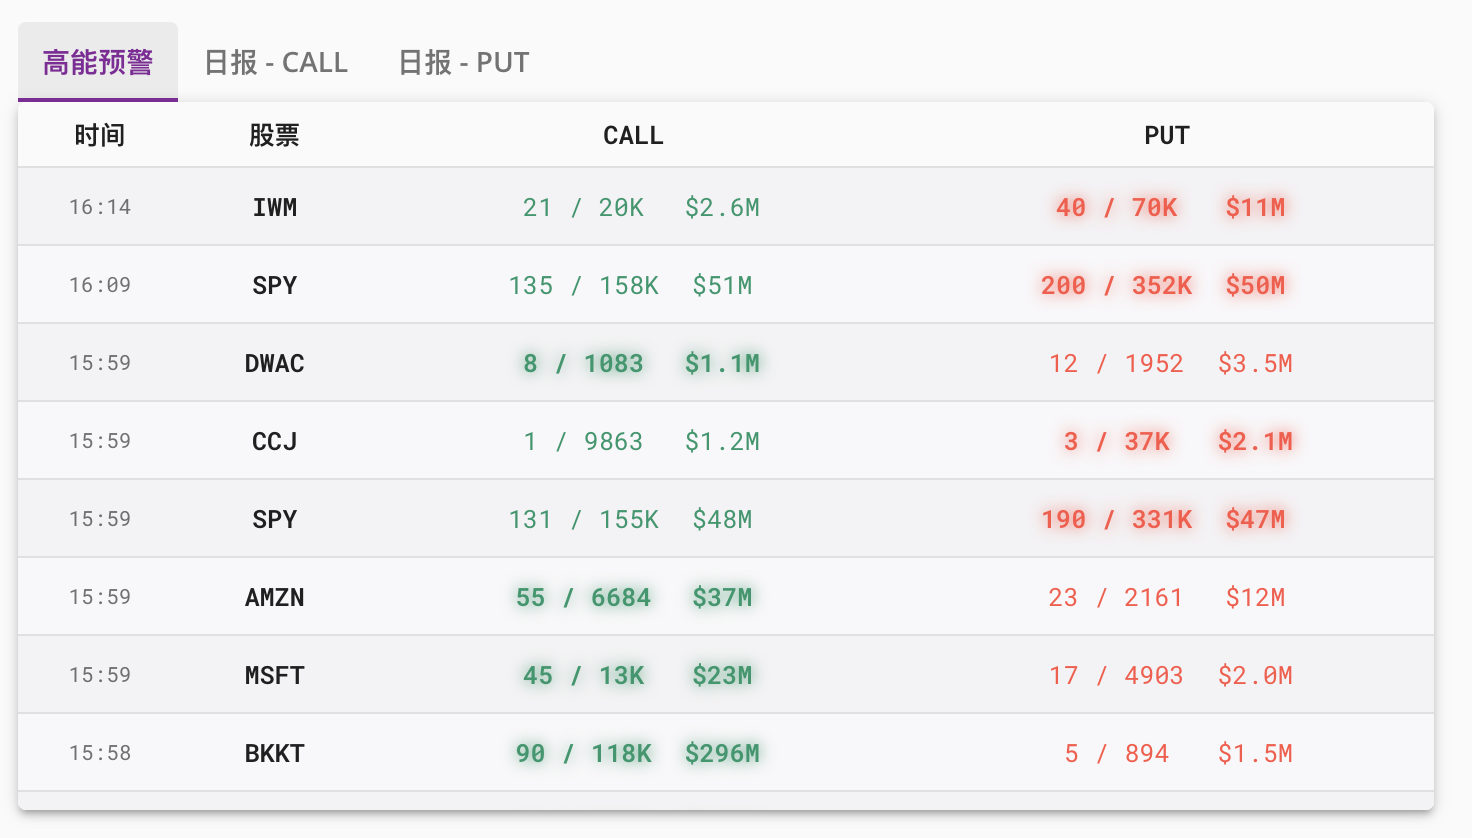
The Attention Flow service helps swiftly identifying active options trades throughout the trading day. It operates by sending notifications when multiple option flows occur for the same stock on the same day. This service provides critical data, including the total count of option flows, the number of contracts involved, and the total premium values.
Take the first row of the chart above as an illustrative example: At 16:14 for IWM, there were 21 call option flows, amounting to 20,000 contracts traded, with a premium totaling $2.6 million. Additionally, there were 40 put option flows, resulting in 70,000 contracts traded, and a premium amounting to $11 million. The highlighting within the chart signifies the option that triggered a high-powered alert. In the first row, the high-powered alert is activated by IWM's put option (Put). This feature aids users in swiftly identifying significant trading activities and potential market-moving events.
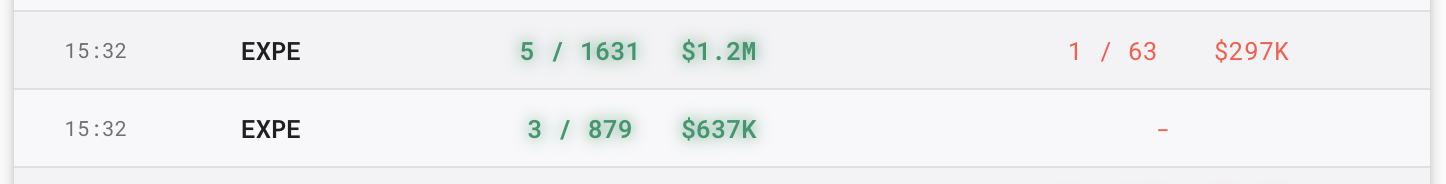
As demonstrated in the example above, the Attention Flow is activated multiple times by call options for the same stock, such as EXPE.
Filters can be effectively employed to display filtered stock-specific Attention Flow results or refine the results by stock types.
Please note: The data is calculated based on QOG option flow, and is the result after excluding market index. If you wish to see data related with market index, please setup a custom filter.
Snapshot
Functionality: Daily Snapshot Service for Comprehensive Option Flow Summaries
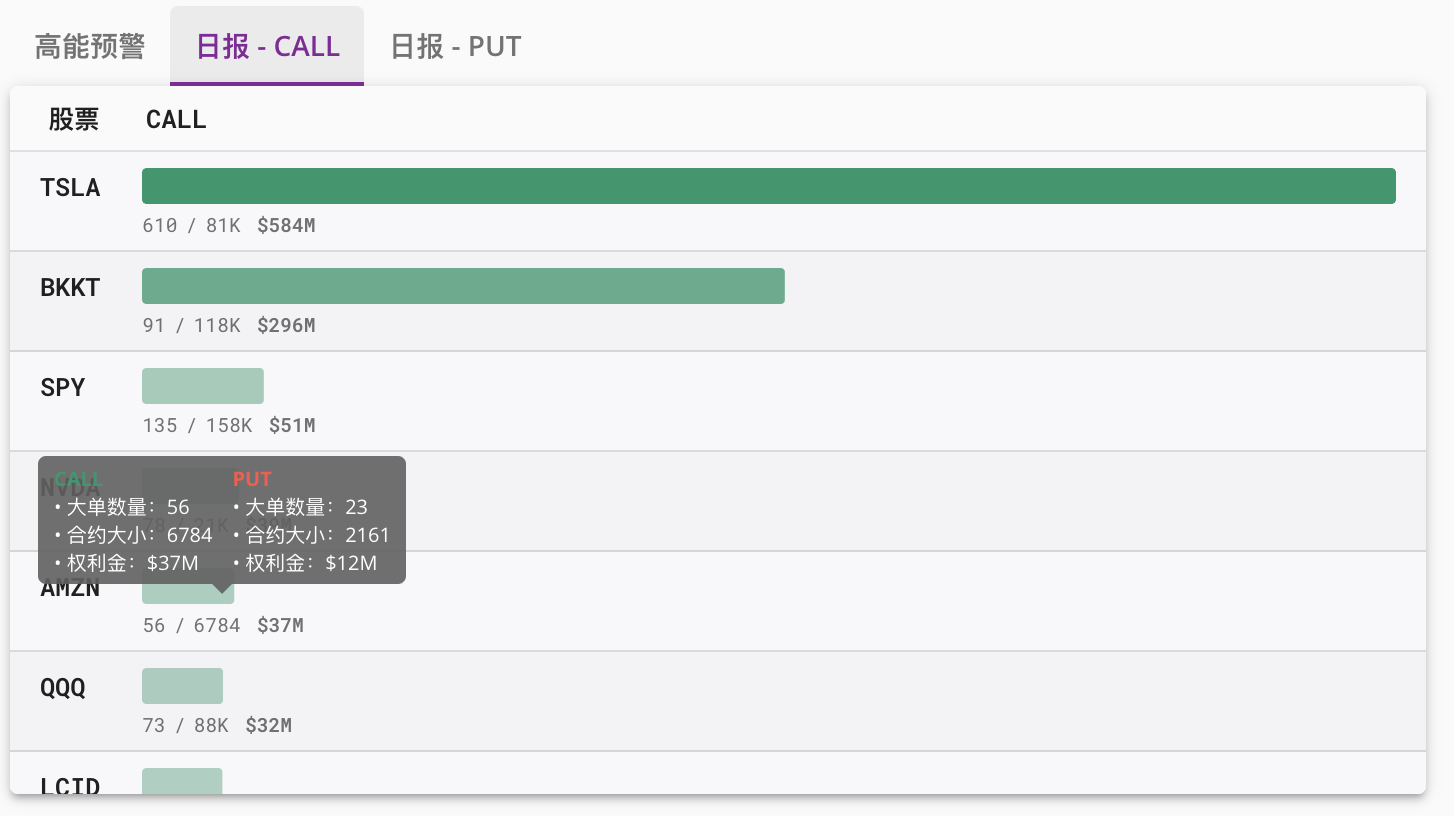
Daily Snapshot service is designed to provide a summary of the number and magnitude of option flows for the day. It presents the most active stocks, ranked from highest to lowest based on their option flow activities.
Taking the first line of the chart above as an example: Stock TSLA holds the distinction of having the largest call option order for the day, featuring 610 option flows, a total of 81,000 options traded, and a premium value of $584 million.
Filters can be employed to refine the daily results, focusing on specific stocks or stock types that align with your preferences.
When exploring the chart, hover your mouse cursor over the numbered rows to reveal specific details for each entry:
- Order Count: Indicates the number of option flows within the selected time range (not to be confused with the total number of options traded).
- Contract Size: Represents the cumulative sum of contracts associated with all option flows.
- Premium: Signifies the aggregate total of premiums linked to the option flows.
Please note: The data is calculated based on QOG option flow, and is the result after excluding market index. If you wish to see data related with market index, please setup a custom filter.
Dashboard

Our dashboard offers a comprehensive analysis of the put and call option ratios for the current trading day. This analysis is presented in four distinct cells:
1. Premium-Based Ratio: The first cell computes the put to call option ratio based on the premium amount for the current day. It calculates this ratio as the premium of put options divided by the premium of call options.
2. Contract-Based Ratio: In the second cell, the ratio is computed based on the number of contracts traded for the day. This ratio is calculated as the number of put option contracts divided by the number of call option contracts.
3. Total Call Option Flow Premiums: The third cell provides the sum of all premium amounts associated with call option flows for the day.
4. Total Put Option Flow Premiums: The fourth cell displays the cumulative premium value of put option flows for the trading day.
This dashboard empowers you with critical insights into the dynamics between put and call options, offering both premium and contract-based perspectives. It aids in making informed decisions and assessing market sentiment throughout the trading day.
Please note: The data is calculated based on QOG option flow, and is the result after excluding market index. If you wish to see data related with market index, please setup a custom filter.
Filter - Notification
To configure filters for the charts displayed below, please follow these steps:
- Locate and click on the 'Settings' button positioned in the upper right corner, as depicted above.
- Within the 'Settings' menu, you will find options to customize filters based on your preferences.
Option Push Filter
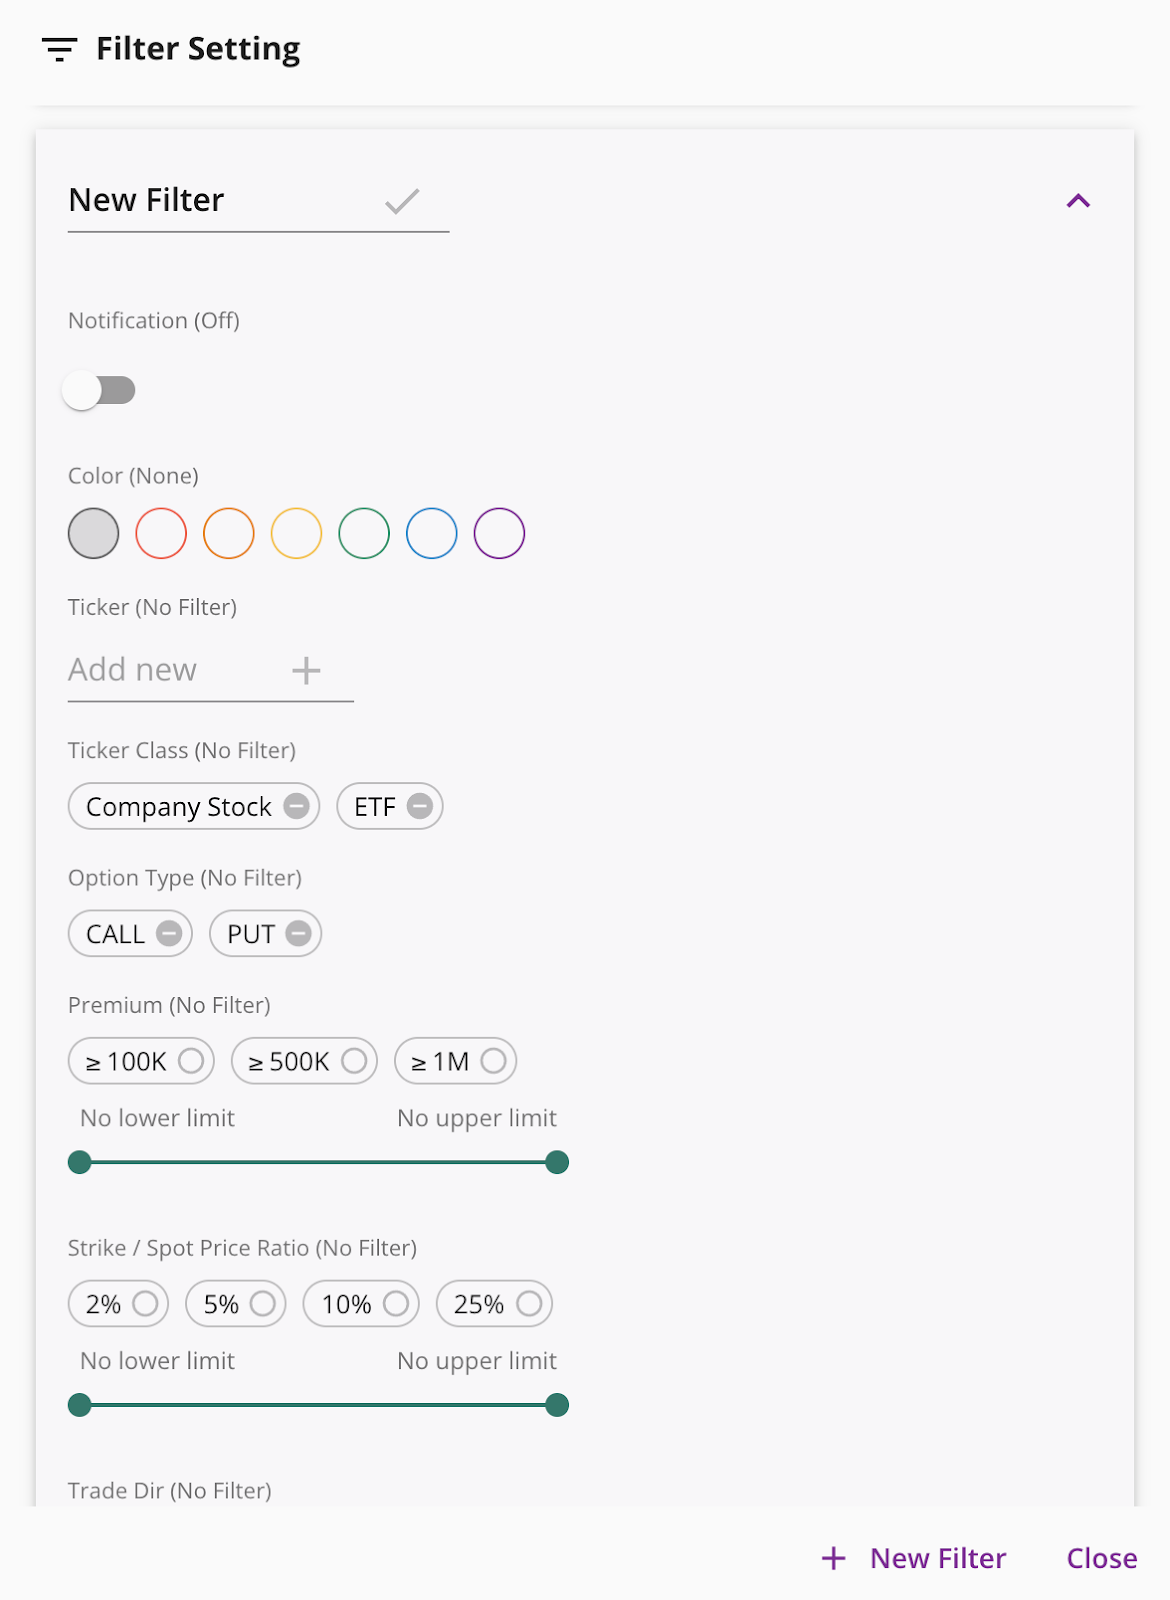
- Filter Name: In the first line, you can change the name of your filter.
- Saving Changes: Once you have made the desired adjustments, simply click the check mark button or press 'Enter' to save the changes.
- Notification Status: The status 'Notification (Off)' indicates that notifications are currently disabled for the filter within the graph. When you activate the notification feature for this filter, it will switch to 'Notification (On)'. The notification service will then push notifications for option flow data that matches the filter criteria. Please note that you may need to enable browser alerts for QOG site notifications to receive these notifications.
- Color: The color setting allows you to assign a specific color to the filter. This color will be used as a background color in the option push results or as a colored dot in the notification alerts.
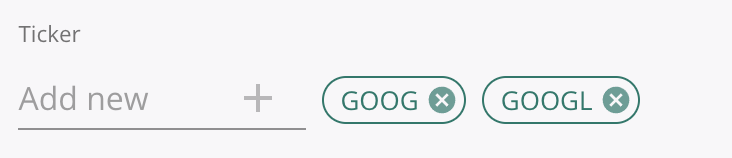
The example below is stock ticker filter. If the filter list is empty, you will receive unfiltered tickers. You can also filter on stock type, option type, premium amount value, ratio of strike price to current stock price, trade direction, trade type, expiration date, ratio of contract size to open position, contract size, and open position.
注:内容根据屏幕分辨率自适应排版。
期权推送
期权推送服务提供QOG精选期权大单实时推送,大单提供信息包括:
- 时间(美东时间)
- 股票代码
- P/C(看跌或是看涨期权)
- 方向(具体解析如下)
- 权利金金额
- 到期日(天数)
- 当前股价
- 行权价
- 类型(具体解析如下)
- 详情(期权数量&每张期权价格)
- 未平仓量 (截止上一个交易日,非实时)
方向:
- 极速买入:极度高于现价成交,出现于买方快速买入
- 买入:高于现价成交,出现于买方主动买入
- 中性:现价成交
- 卖出:低于现价成交,出现于卖方主动卖出
- 极速卖出:极度低于现价成交,出现于卖方快速出售
类型:
- Sweep: 多交易所成交,它被分成不同的部分,以利用所有交易所当前提供的最优惠价格的所有可用合约。
- Block:大宗交易(block trading),又称为大宗买卖,是指达到规定的最低限额的证券单笔买卖申报,买卖双方经过协议达成一致并经交易所确定成交的证券交易
- Split:单交易所极速,单交易者在同一时间同一交易所下多单
请注意:默认情况下的数据是排除市场指数后的结果。如果您想查看市场指数相关数据,请自行设置过滤器。
日内统计图
作用:日内统计图针对到期日分类及交易方向提供总结
每格内上方数字(绿色)表示看涨金额数据,下方数字(红色)表示看跌金额数据,颜色深浅和权利金金额成正比例相关,可以通过鼠标指向具体金额看到详情,如下图所示:
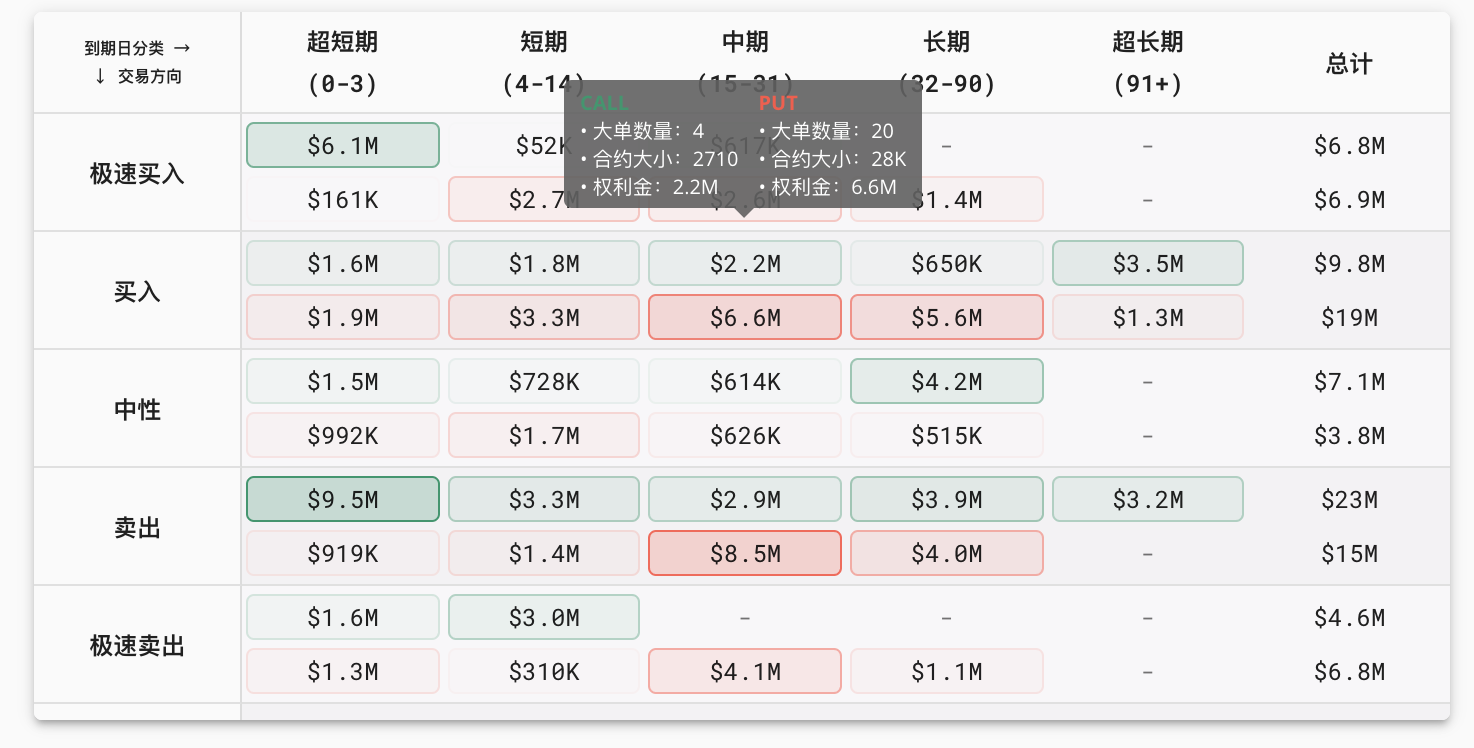
大单数量表示今日大单个数(非期权成交总数),合约大小表示大单期权合约数量之和,权利金表示大单总权利金之和。
可使用过滤器针对特定股票或者股票类型显示过滤过的日内总结。
请注意:默认情况下的数据是排除市场指数后的结果。如果您想查看市场指数相关数据,请自行设置过滤器。
高能预警
作用:期权高能预警帮助快速发现本日活跃的期权交易。
期权高能预警服务推送同一只股票在当天出现多个期权大单的次数及权利金总额。以上图第一行为例:IWM截止16:14,看涨期权大单数量21个,总期权成交数量为20k个合约,权利金$2.6M;看跌期权大单数量40个,总期权成交数量为70k个合约,权利金$11M。高亮表示触发该条高能预警的期权,如第一行为例,该条高能预警由IWM的看跌期权(Put)触发。
如上图为例,高能预警多次由同一支股票EXPE的看涨期权触发。可使用过滤器针对特定股票或者股票类型显示过滤过的股票高能预警结果。
请注意:默认情况下的数据是排除市场指数后的结果。如果您想查看市场指数相关数据,请自行设置过滤器。
日报
作用:期权日报服务总结当日股票期权交易大单数量及金额大小。
期权日报服务总结当日股票期权交易大单数量及金额大小,从高到底显示最为活跃的股票。以上图第一行为例:股票TSLA,看涨期权大单金额为今日第一名,大单数量610个,总期权成交数量为81k个合约,权利金$584M。
可使用过滤器针对特定股票或者股票类型显示过滤过的日报结果。
鼠标指向数字行可以看到具体详情。包括该股票看涨看跌期权的大单数量表示今日大单个数(非期权成交总数),合约大小表示大单期权合约数量之和,以及权利金表示大单总权利金之和。
请注意:默认情况下的数据是排除市场指数后的结果。如果您想查看市场指数相关数据,请自行设置过滤器。
仪表盘

仪表盘提供当日看跌看涨期权比例分析。
- 第一格根据当日权利金数额计算比例(看跌期权除以看涨期权)
- 第二格根据当日合约数计算比例
- 第三格显示当日看涨期权大单权利金总和
- 第四格显示当日看跌期权大单权利金总和。
请注意:该数据的计算基于QOG期权数据,并且是排除市场指数后的结果。
过滤器 - 通知
点击右上角如上图所示设置按钮可针对下方显示图表进行过滤设置。
期权推送过滤器
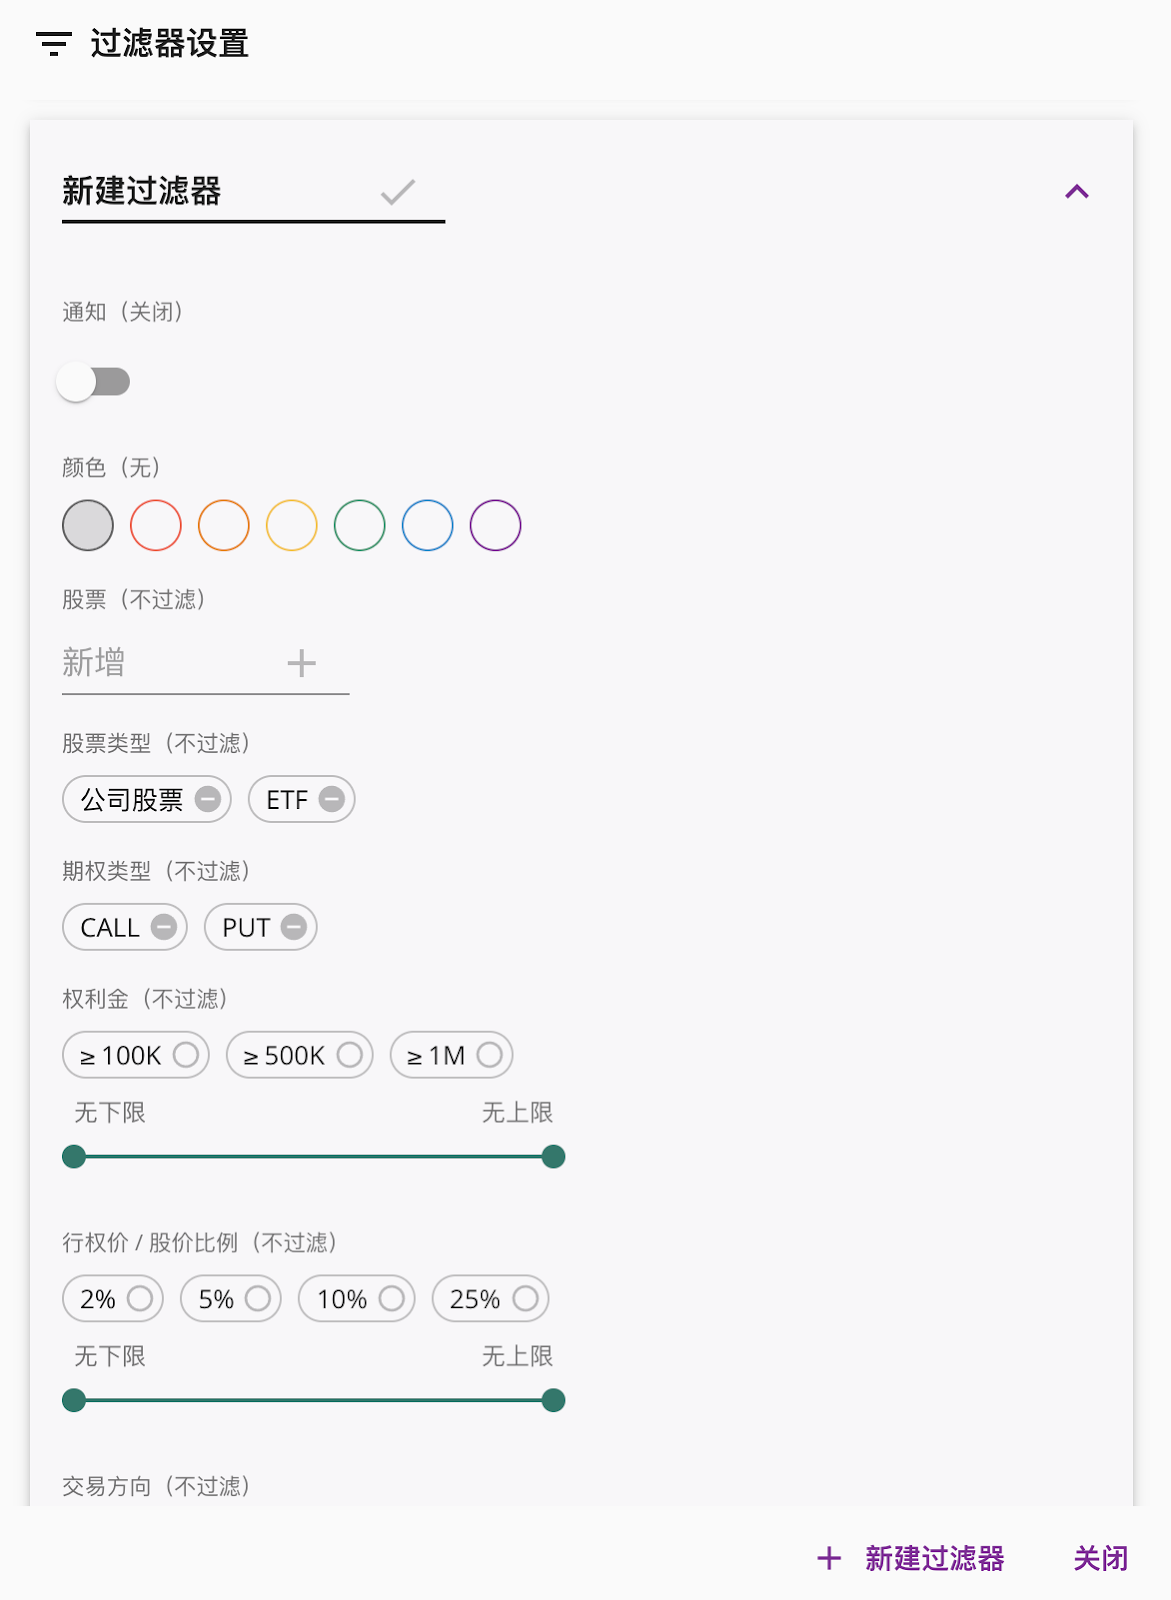
您可以在第一行横线处自定义过滤器名称,更改完毕请点击打钩键或按下回车键以保存修改。
通知(关闭)设置如果开启,将会对该过滤器推送大单进行通知服务(您可能需要允许浏览器对QOG网站通知进行提醒的服务以接收浏览器提醒)。
颜色设置将为该过滤器设置特定颜色,颜色会在期权推送结果以背景色展示,或是在通知提醒里以有颜色的圆点展示出。
下面的例子是股票代码过滤器。过滤器设置若为空,将接受所有股票。您还可以针对股票类型,期权类型,权利金金额值域,行权价和当前股价的比例,交易方向,交易类型,到期日,合约大小和未平仓量的比例,合约大小,未平仓量进行过滤。